Often, one wants to compile statistics on what is going on in the optimization. The Statistics are able to compile such data on arbitrary attributes of any designated object. To do that, one need to register the desired statistic functions inside the stats object using the exact same syntax as the toolbox.
stats = tools.Statistics(key=lambda ind: ind.fitness.values)
The statistics object is created using a key as first argument. This key must be supplied a function that will later be applied to the data on which the statistics are computed. The previous code sample uses the fitness.values attribute of each element.
stats.register("avg", numpy.mean)
stats.register("std", numpy.std)
stats.register("min", numpy.min)
stats.register("max", numpy.max)
The statistical functions are now registered. The register function expects an alias as first argument and a function operating on vectors as second argument. Any subsequent argument is passed to the function when called. The creation of the statistics object is now complete.
When using a predefined algorithm such as eaSimple(), eaMuPlusLambda(), eaMuCommaLambda(), or eaGenerateUpdate(), the statistics object previously created can be given as argument to the algorithm.
pop, logbook = algorithms.eaSimple(pop, toolbox, cxpb=0.5, mutpb=0.2, ngen=0,
                                   stats=stats, verbose=True)
Statistics will automatically be computed on the population every generation. The verbose argument prints the statistics on screen while the optimization takes place. Once the algorithm returns, the final population and a Logbook are returned. See the next section or the Logbook documentation for more information.
When writing your own algorithm, including statistics is very simple. One need only to compile the statistics on the desired object. For example, compiling the statistics on a given population is done by calling the compile() method.
record = stats.compile(pop)
The argument to the compile function must be an iterable of elements on which the key will be called. Here, our population (pop) contains individuals. The statistics object will call the key function on every individual to retrieve their fitness.values attribute. The resulting array of values is finally given the each statistic function and the result is put into the record dictionary under the key associated with the function. Printing the record reveals its nature.
>>> print(record)
{'std': 4.96, 'max': 63.0, 'avg': 50.2, 'min': 39.0}
How to save and pretty print the statistics is shown in the next section.
As statistics are computed directly on the values with numpy function, all the objectives are combined together by the default behaviour of numpy. Thus, one need to specify the axis on which to operate. This is achieved by giving the axis as an aditional argument to the register function.
stats = tools.Statistics(key=lambda ind: ind.fitness.values)
stats.register("avg", numpy.mean, axis=0)
stats.register("std", numpy.std, axis=0)
stats.register("min", numpy.min, axis=0)
stats.register("max", numpy.max, axis=0)
One can always specify the axis even in the case of single objective. The only effect is to produce a different output, as the objects are numpy arrays.
>>> print(record)
{'std': array([ 4.96]), 'max': array([ 63.]), 'avg': array([ 50.2]),
'min': array([ 39.])}
It is also possible to compute statistics on different attributes of the population individuals. For instance, it is quite common in genetic programming to have statistics on the height of the trees in addition to their fitness. One can combine multiple Statistics object in a MultiStatistics.
stats_fit = tools.Statistics(key=lambda ind: ind.fitness.values)
stats_size = tools.Statistics(key=len)
mstats = tools.MultiStatistics(fitness=stats_fit, size=stats_size)
Two statistics objects are created in the same way as before. The second object will retrieve the size of the individuals by calling len() on each of them. Once created, the statistics objects are given to a MultiStatistics one, where the arguments are given using keywords. These keywords will serve to identify the different statistics. The statistical functions can be registered only once in the multi-statistics, as shown below, or individually in each statistics.
mstats.register("avg", numpy.mean)
mstats.register("std", numpy.std)
mstats.register("min", numpy.min)
mstats.register("max", numpy.max)
The multi-statistics object can be given to an algorithm or they can be compiled using the exact same procedure as the simple statistics.
record = mstats.compile(pop)
This time the record is a dictionary of dictionaries. The first level contains the keywords under which the statistics objects have been registered and the second level is similar to the previous simple statistics object.:
>>> print(record)
{'fitness': {'std': 1.64, 'max': 6.86, 'avg': 1.71, 'min': 0.166},
'size': {'std': 1.89, 'max': 7, 'avg': 4.54, 'min': 3}}
Once the data is produced by the statistics (or multi-statistics), one can save it for further use in a Logbook. The logbook is intended to be a chronological sequence of entries (as dictionaries). It is directly compliant with the type of data returned by the statistics objects, but not limited to this data. In fact, anything can be incorporated in an entry of the logbook.
logbook = tools.Logbook()
logbook.record(gen=0, evals=30, **record)
The record() method takes a variable number of argument, each of which is a data to be recorded. In the last example, we saved the generation, the number of evaluations and everything contained in the record produced by a statistics object using the star magic. All record will be kept in the logbook until its destruction.
After a number of records, one may want to retrieve the information contained in the logbook.
gen, avg = logbook.select("gen", "avg")
The select() method provides a way to retrieve all the information associated with a keyword in all records. This method takes a variable number of string arguments, which are the keywords used in the record or statistics object. Here, we retrieved the generation and the average fitness using a single call to select.
A logbook is a picklable object (as long as all inserted objects are picklable) providing a very nice way to save the statistics of an evolution on disk.
import pickle
pickle.dump(logbook, open("logbook.pkl", "w"))
Note
Every algorithm returns a logbook containing the statistics for every generation and the number of evaluation for the whole evolution.
A logbook can be printed to screen or file. Its __str__() method returns a header of each key inserted in the first record and the complete logbook for each of these keys. The row are in chronological order of insertion while the columns are in an undefined order. The easiest way to specify an order is to set the header attribute to a list of strings specifying the order of the columns.
logbook.header = "gen", "avg", "spam"
The result is:
>>> print(logbook)
gen   avg      spam
0     [ 50.2]
A column name containing no entry in a specific record will be left blank as for the spam column in the last example.
A logbook also contains a stream property returning only the yet unprinted entries.
>>> print(logbook.stream)
gen   avg      spam
0     [ 50.2]
>>> logbook.record(gen=1, evals=15, **record)
>>> print(logbook.stream)
1     [ 50.2]
The logbook is able to cope with the dictionary of dictionaries return by the MultiStatistics object. In fact, it will log the data in chapters for each sub dictionary contained in the record. Thus, a multi record can be used exactly as a record.
logbook = tools.Logbook()
logbook.record(gen=0, evals=30, **record)
One difference is the column ordering, where we can specify an order for the chapters and their content as follows:
logbook.header = "gen", "evals", "fitness", "size"
logbook.chapters["fitness"].header = "min", "avg", "max"
logbook.chapters["size"].header = "min", "avg", "max"
The resulting output is:
>>> print(logbook)
                     fitness                 size
            -------------------------  ---------------
gen   evals min      avg      max      min   avg   max
0     30    0.165572 1.71136  6.85956  3     4.54  7
Retrieving the data is also done through the chapters.
gen = logbook.select("gen")
fit_mins = logbook.chapters["fitness"].select("min")
size_avgs = logbook.chapters["size"].select("avg")
The generations, minimum fitness and average size are obtained, chronologically ordered. If some data is not available, a None appears in the vector.
One of the most common operation when an optimization is finished is to plot the data during the evolution. The Logbook allows to do this very efficiently. Using the select method, one can retrieve the desired data and plot it using matplotlib.
gen = logbook.select("gen")
fit_mins = logbook.chapters["fitness"].select("min")
size_avgs = logbook.chapters["size"].select("avg")
import matplotlib.pyplot as plt
fig, ax1 = plt.subplots()
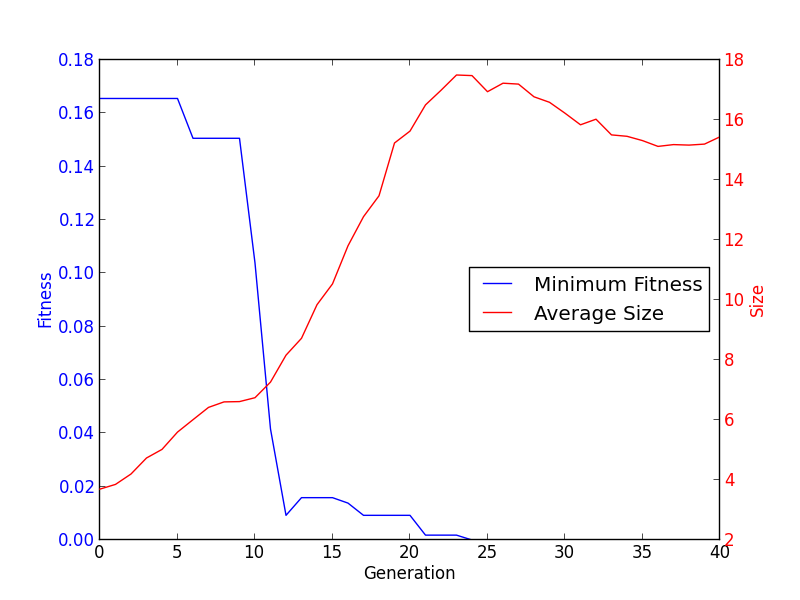
line1 = ax1.plot(gen, fit_mins, "b-", label="Minimum Fitness")
ax1.set_xlabel("Generation")
ax1.set_ylabel("Fitness", color="b")
for tl in ax1.get_yticklabels():
tl.set_color("b")
ax2 = ax1.twinx()
line2 = ax2.plot(gen, size_avgs, "r-", label="Average Size")
ax2.set_ylabel("Size", color="r")
for tl in ax2.get_yticklabels():
tl.set_color("r")
lns = line1 + line2
labs = [l.get_label() for l in lns]
ax1.legend(lns, labs, loc="center right")
plt.show()
When added to the symbolic regression example, it gives the following graphic: